Data related to communication networks is often sensitve and proprietary. Consequently, many networking academic papers are published without open-accessing the network traffic data that was used to obtain the results, and when they are published the datasets are often too limited for data-hungry applications such as reinforcement learning. In an effort to aid reproducibility, some authors release characteristic distributions which broadly describe the underlying data. However, these distributions are often not analytically described and may not fall under the classic 'named' distributions (Gaussian, log-normal, Pareto etc.). As a result, other researchers find themselves using unrealistically simple uniform traffic distributions or their own distributions which are difficult to universally benchmark. This project saw the development of an open-access network traffic generation tool for (1) standardising the traffic patterns used to benchmark networking systems, and (2) enabling rapid and easy replication of literature distributions even in the absence of raw open-access data.
A Case in Point
In one Google DeepMind paper [1], researchers trained a graph neural network (GNN) to place operations (ops) onto machines for real TensorFlow computation (job) graphs. Placing ops and scheduling the tensors (flows) that pass between them is a common task for data centres, which often have many specialised high-bandwidth processing units and are therefore ideal for hosting large-scale machine learning inference and training.
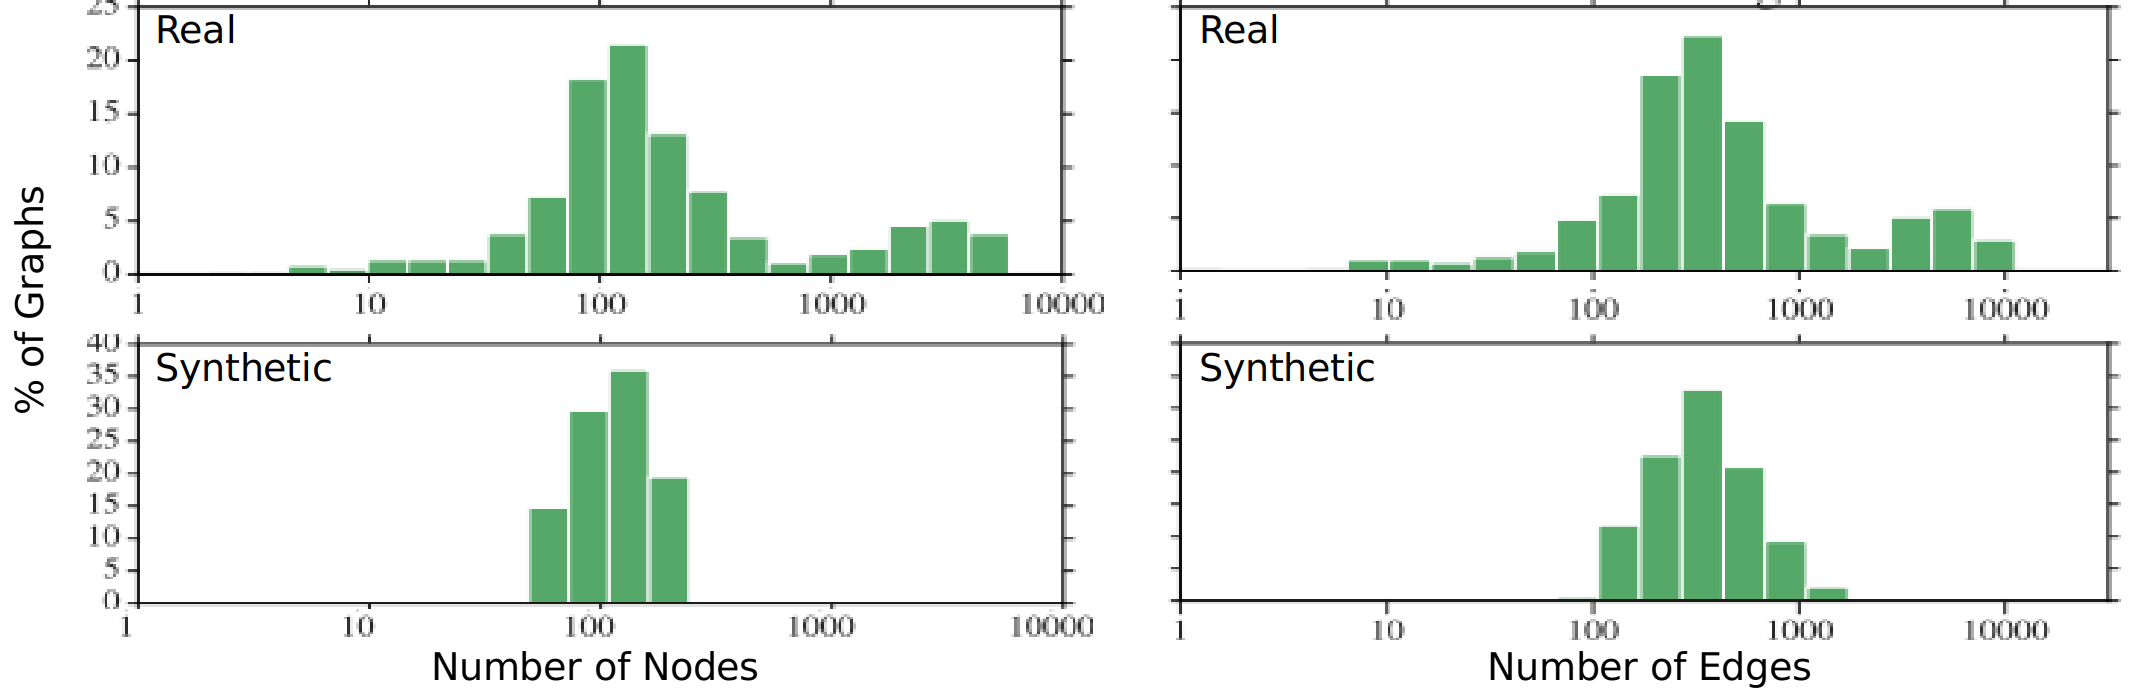
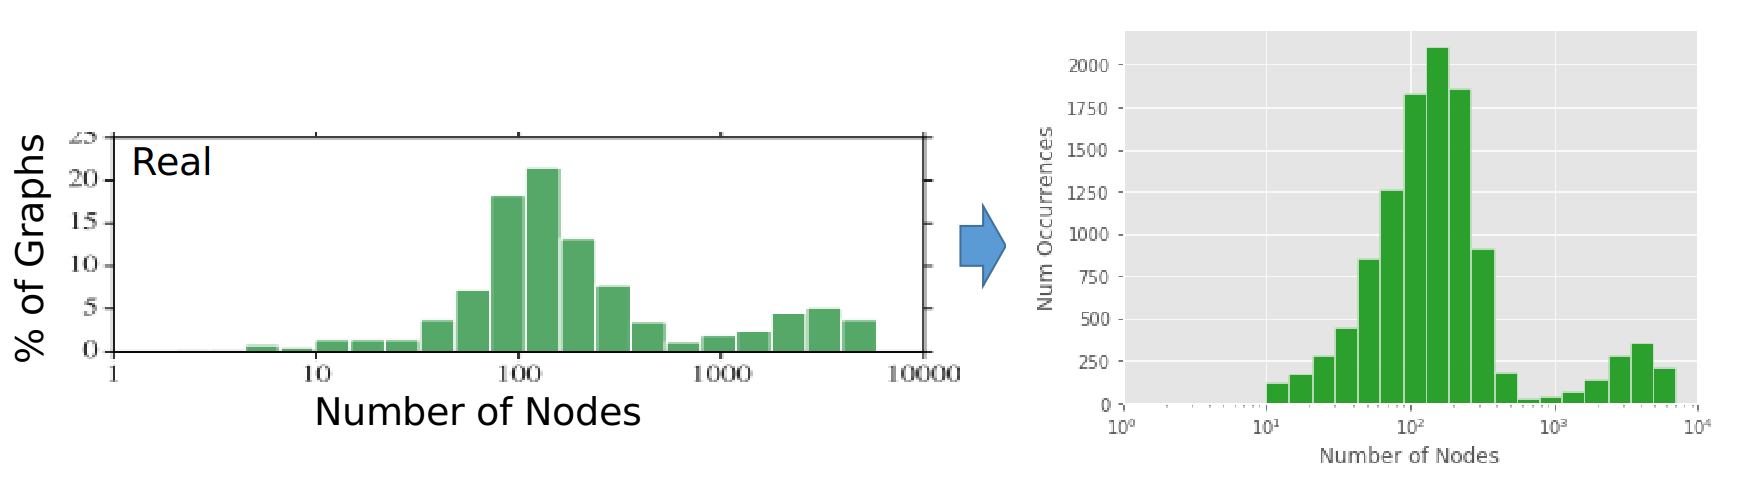
Google did not want to release real TensorFlow data. In an effort to aid reproducibility, the researchers published some characteristic distributions of the real graphs and released a database of 'synthetic' graphs. However, as shown in the image below, the distributions of the real and synthetic graphs are quite different. As such, benchmarking other systems on realistic TensorFlow graphs is not possible using only the synthetic dataset.
Histogram distribution for the number of nodes (operations) in the real and synthetic TensorFlow job graphs.
This is just one of many encounters of distribution-related limitations networking researchers face when reading, reproducing and benchmarking literture results; fragments of information that describe parts of the data which are difficult to piece together into a dataset which accurately mimics the real/original data. How we can make this process quick and easy?
A Visual Tool for Distribution Shaping
Information about distributions is given in many different forms in academic papers. It could be e.g. a drawn distribution (as above), an analytically described named distribution (e.g. 'the connection duration times followed a log-normal distribution with mu -3.8 and sigma 6.4'), a fully analytically described unnamed distribution (e.g. 'the flow sizes followed a distribution with minimum 8, maximum 33,000, mean 6450, skewness 1.23, and kurtosis 2.03') etc. In order to piece together these fragments of information to generate your own traffic dataset with accurate characteristics, it would be useful to have a tool with which you could visually interact with and read data from as you shape your distribution to match the literature.
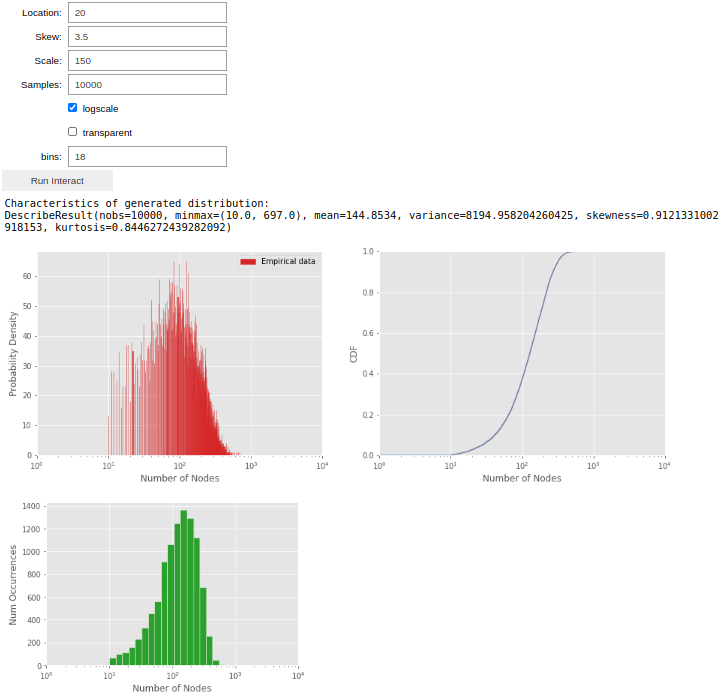
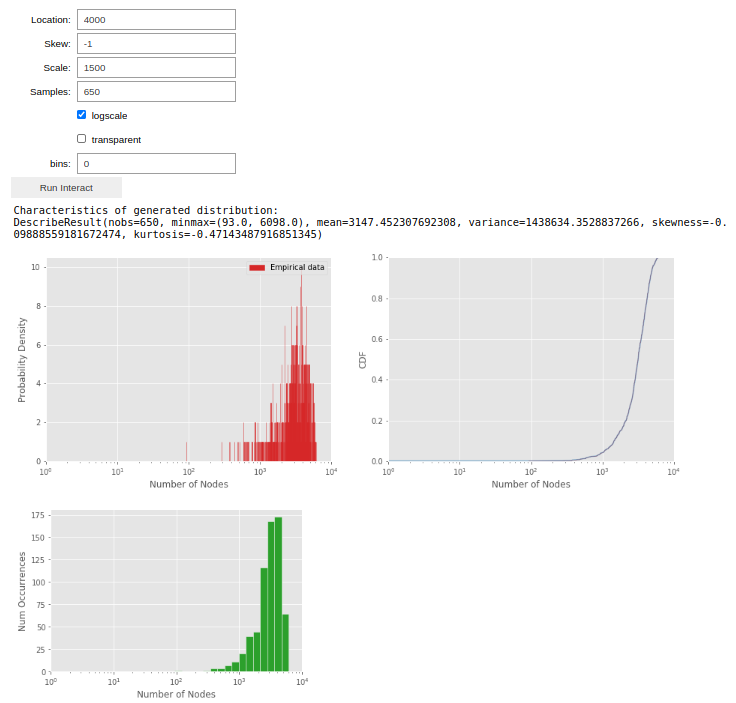
My network traffic generation tool does exactly that. With a Jupyter Notebook front-end, researchers can tune distributions visually and analytically. Graphs are live-updated as slide bars, text boxes etc. are adjusted, with analytical characteristics of the generated distributions being continuously output to aid the researcher. The tool supports both classic named distributions (Gaussian, log-normal, Pareto, exponential etc.) as well as arbitrary unnamed multimodal distributions. For example, for the above 'number of nodes' distribution, no named distribution fits the bimodal distribution of the real TensorFlow graphs. Using the distribution tool, however, we can simply enter that there are 2 modes and that the minimum and maximum random variable values are 10 and 7,000 respectively, and then proceed to shape each mode individually by adjusting the 'location' (~mean), 'skew' (~skewness), 'scale' (~standard deviation) and 'samples' (~histogram height) shaping parameters:
Output of the tool for the shaped distribution of the first mode for the literature node distribution.
Output of the tool for the shaped distribution of the second mode for the literature node distribution.
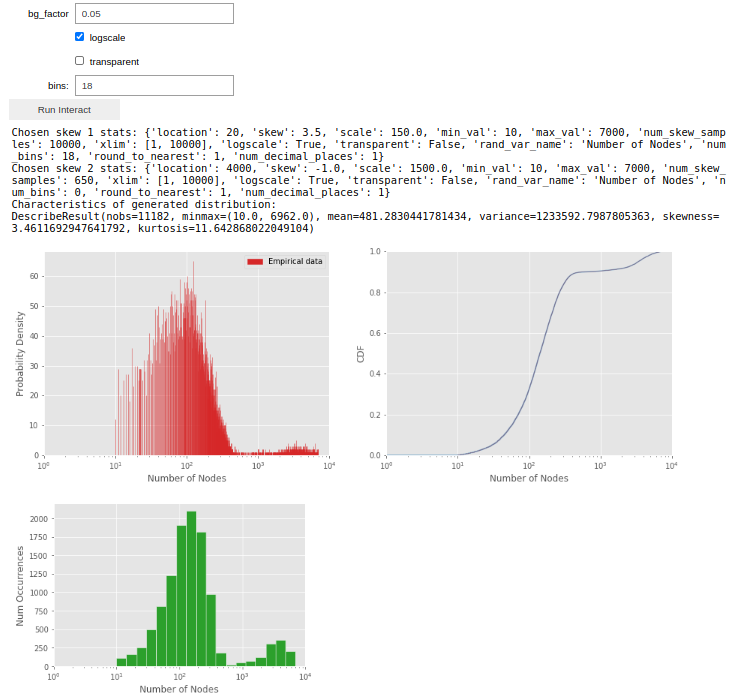
The tool then combines the modes you've shaped (in this case, 2 modes) into a single distribution, and prints both an analytical description of the final distribution and the final parameters you shaped so that future researchers can use the tool to easily reproduce your arbitrary distribution. To add noise to the distributions, a 'background noise factor' can also be adjusted:
Output of the tool for the shaped distribution when the shaped first and second modes are combined into a single distirbution.
Shaping this distribution with the tool was quick and easy to do, and more accurately mimics the real TensorFlow number of nodes distribution than the published synthetic dataset. Furthermore, it would be very easy for future researchers to reproduce this distribution and use it to generate as much data as they like so long as the chosen skew characteristics (printed by the tool in the above images) are shared.
End-to-End Network Traffic Generation
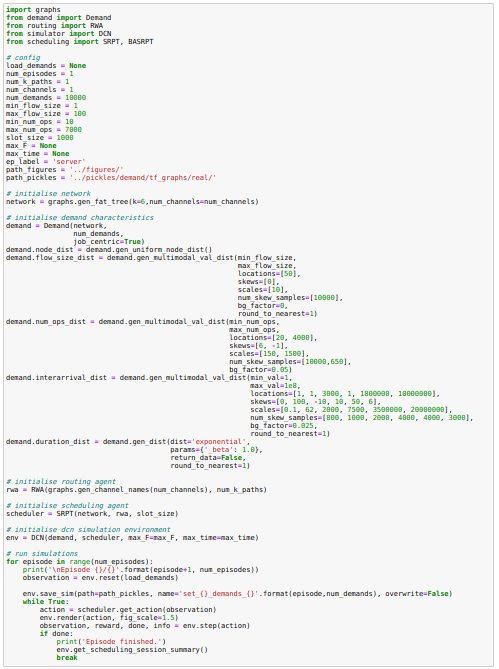
Once the distributions have been shaped, the chosen distribution parameters can be noted down and seemlesly integrated with the back-end traffic demand generation tool. The tool supports any network topology, and supports both 'flow-centric' (no job graphs, consider flows as individual demands) or 'job-centric' (each flow is part of a job graph with dependencies) approaches to networking.
In the below example, all the characteristic distributions needed to describe machine learning job/computation graph demands in data centres are shaped with the tool using information from the literature. Then an example of how the traffic demand back-end module can be imported and configured to adopt the shaped attributes is shown. This is then integrated with a demo simulation environment in which an agent interacts with the data centre network and learns to schedule machine learning job graphs following an OpenAI Gym reinforcement learning framework. I hope to open-access both the traffic generation tool and the data centre reinforcement learning environment soon.
**N.B. If users wish to, rather than using the back-end traffic demand module to adopt the shaped distributions, they can export the distribution probability mass functions and/or the raw random variable data sampled from the shaped distributions as a .csv file. This can then be imported into their own simulations/scripts.**
Important computation job graph characteristics whose distributions should be shaped:
Job interarrival time
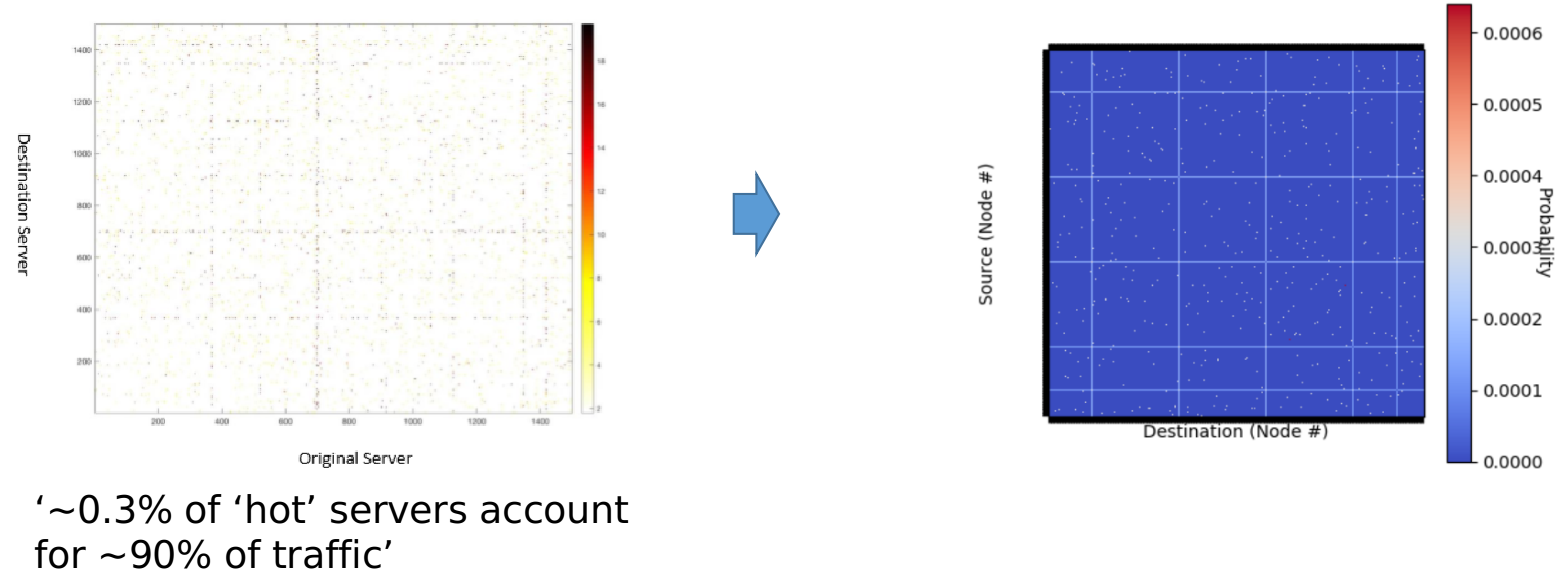
Which machine each op in the job is placed on (corresponds to source-destination pair for each flow/tensor dependency between ops)
Number of ops in the job graph
Op run times
Size of data dependency flows between ops
Ratio of control to data dependencies in job graph
Connectivity of job graph
Ratio of control to data dependencies in job graph
Connectivity of job graph
[1]
Reproducing number of nodes distribution.
[1]
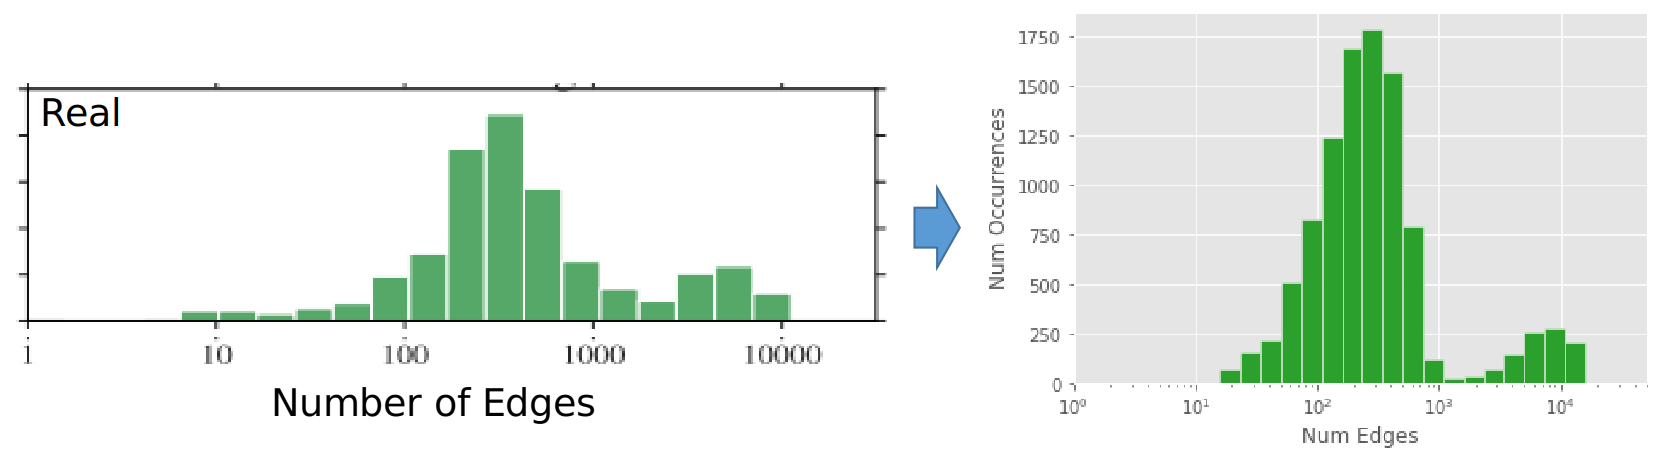
Reproducing number of edges distribution.
[1]
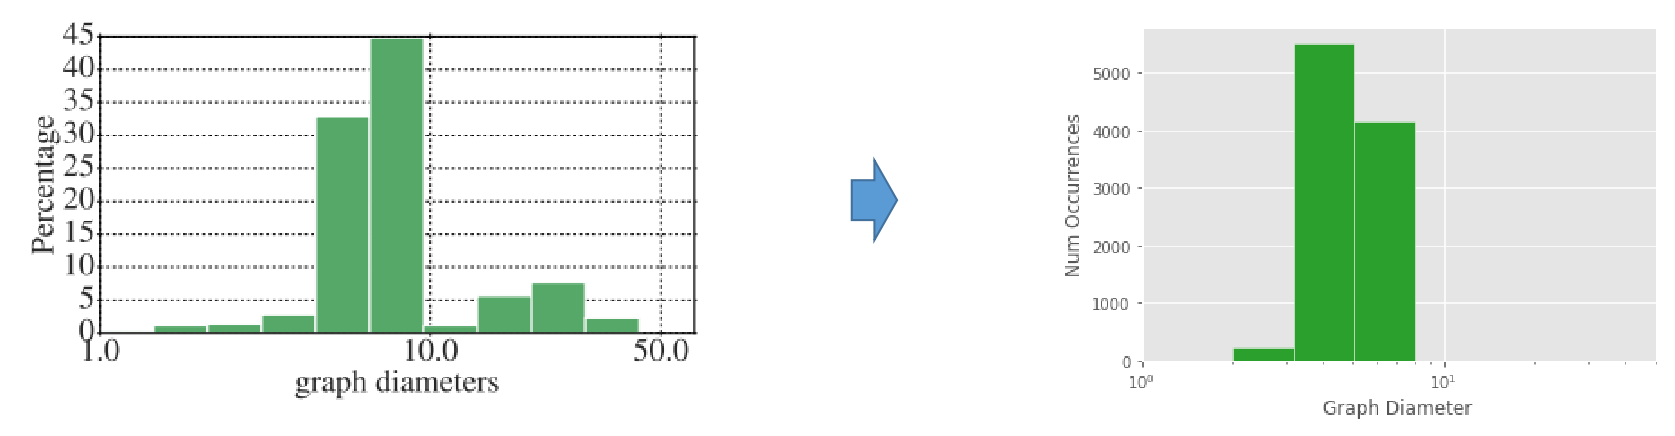
Reproducing graph diameter distribution.
[1]
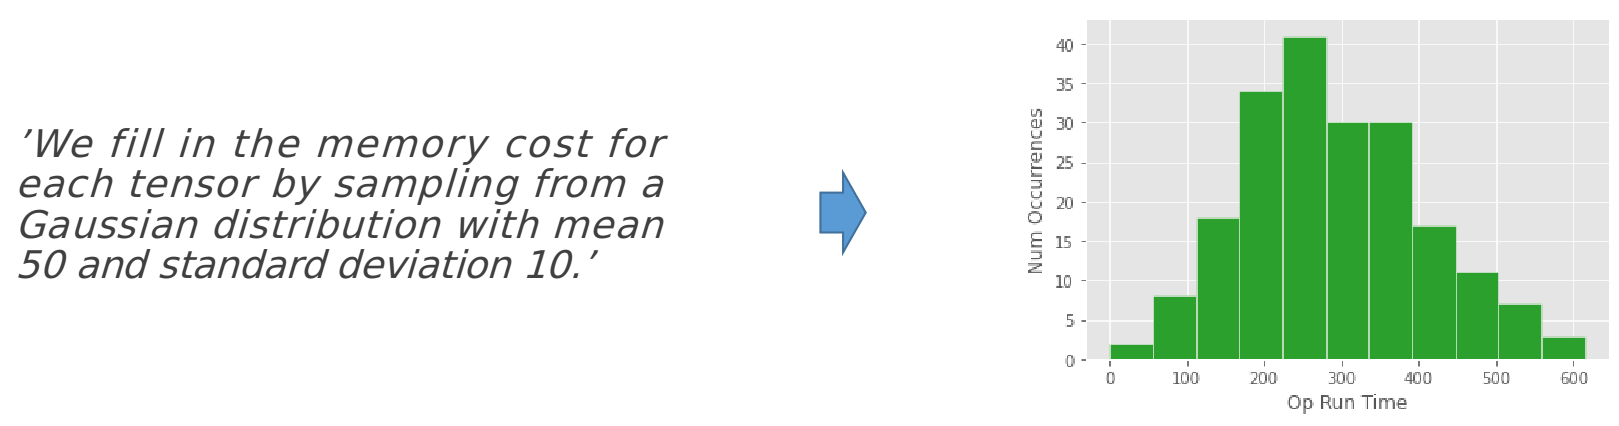
Reproducing op run time distribution.
[1]
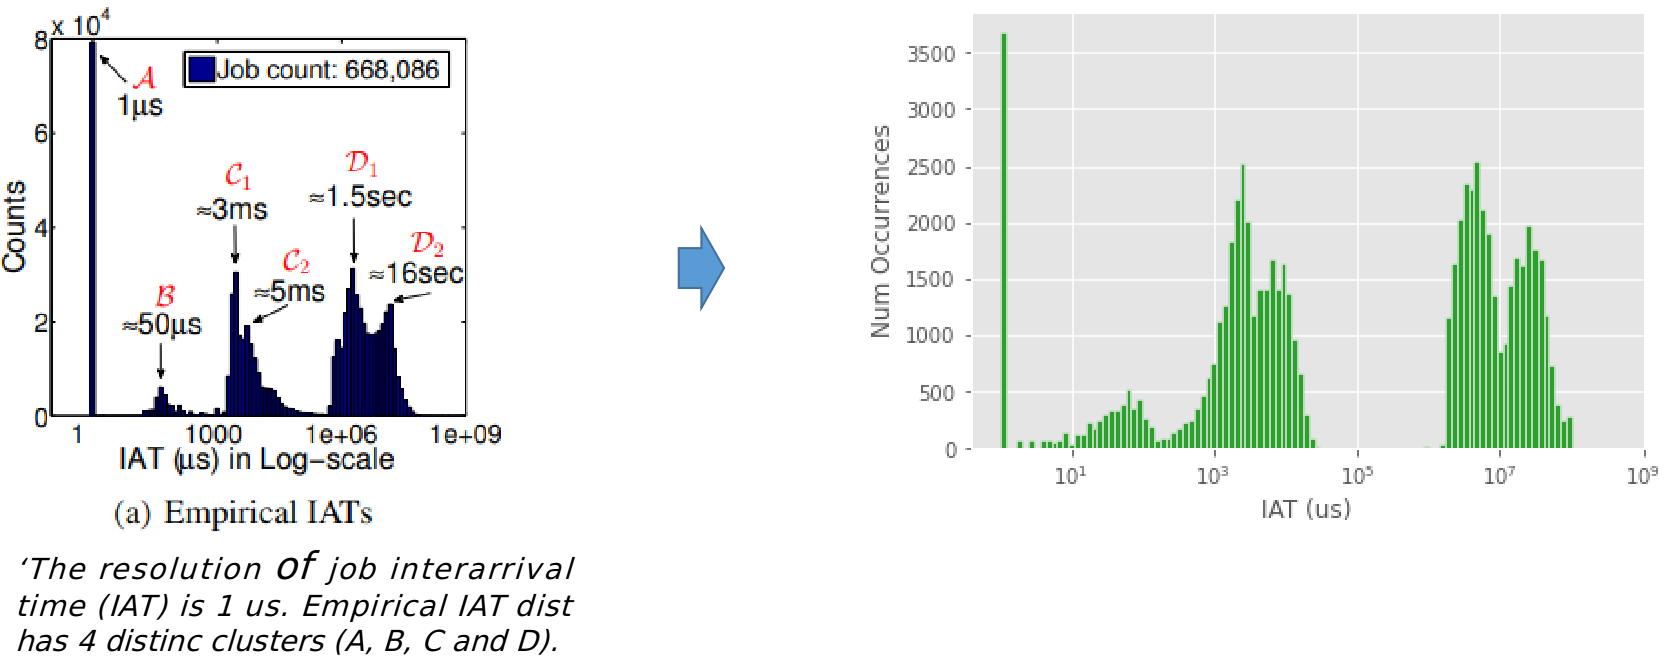
Reproducing job interarrival time (IAT) distribution.
Implementing the above distributions with the traffic demand back-end module and running a reinforcement learning data centre simulation environment to train an agent to schedule the flows of machine learning jobs in a fat-tree topology data centre network.
References
A. Paliwal et al., ‘Reinforced Genetic Algorithm Learning for Optimizing Computation Graphs’, International Conference on Learning Representations (ICLR), 2020
D. -C. Juan et al., ‘Beyond Poisson: Modeling Inter-Arrival Time of Requests in a Datacenter’, Advances in Knowledge Discovery and Data Mining (PAKDD), 2014
X. Fang et al., ‘Analysis and Simulation of Traffic Patterns in Data Centres’, University College London Report, 2018